- The Nasdaq has experienced numerous corrections of 10%–35% over the past two decades, yet has consistently recovered to new highs when earnings growth and innovation cycles remained intact. The current pullback follows a period where the Nasdaq-100 gained more than 80% from its 2022 lows.
- AI-driven mega-cap technology companies now account for an unprecedented share of index performance. Microsoft, NVIDIA, Amazon, Meta, Alphabet, and Apple collectively represent well over $15 trillion in market capitalization and drive a significant portion of Nasdaq returns.
- Historical data shows that corrections inside secular bull markets are common. During the 2009–2021 expansion, the Nasdaq experienced multiple double-digit declines before ultimately delivering one of the strongest long-term returns of any major global equity index.
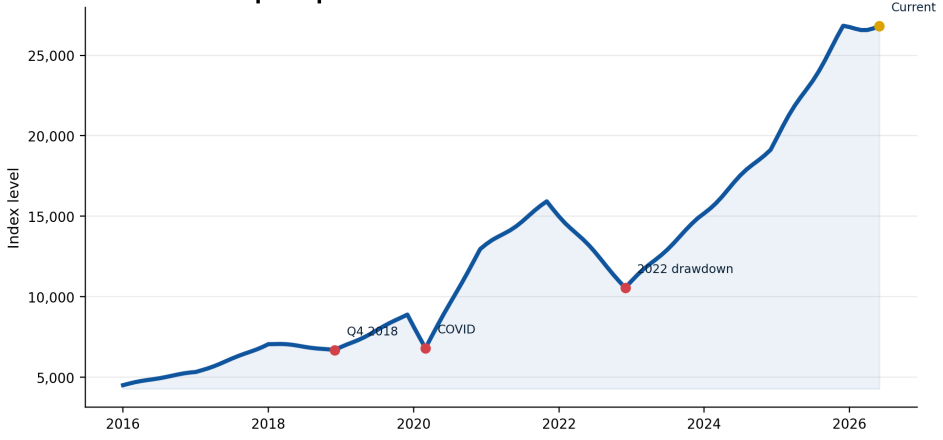
drawdowns in 2018, 2020, and 2022 were painful, but the longer-term path still trended higher.
Executive Summary
The recent Nasdaq correction has generated concern among investors, particularly after a powerful rally fueled by artificial intelligence, cloud computing, semiconductors, and digital infrastructure spending. While short-term volatility has increased, historical market behavior suggests that corrections alone do not necessarily signal the end of a bull market.
The Nasdaq remains one of the world’s most important benchmarks for innovation-driven companies. Even after recent weakness, both the Nasdaq Composite and Nasdaq-100 remain significantly above their long-term averages and continue to be supported by strong earnings growth from the largest technology companies.
Current Market Snapshot
| Metric | Approximate Level |
|---|---|
| Nasdaq Composite | 26,800 |
| Nasdaq-100 | 30,000+ |
| Nasdaq Composite Total Return | 33,000+ |
| Nasdaq-100 Total Return | 37,000+ |
| Nasdaq-100 Technology Sector | 18,000+ |
Investor Focus Areas
- AI monetization
- Corporate earnings growth
- Interest-rate expectations
- Technology sector concentration
- Capital expenditure trends
- Cloud infrastructure demand
Understanding Nasdaq Corrections Through History
One of the biggest mistakes investors make during corrections is assuming every decline marks the beginning of a bear market.
History suggests otherwise.
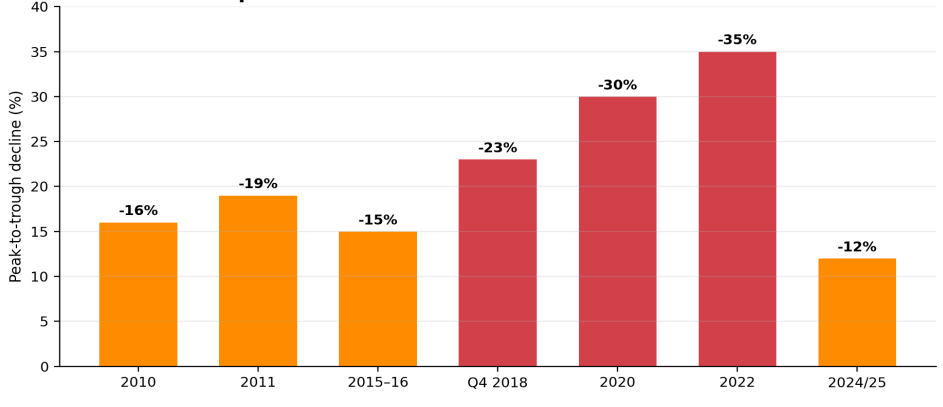
Major Nasdaq Corrections Since 2009
| Year | Approximate Decline | Primary Cause |
| 2010 | -16% | European debt crisis |
| 2011 | -19% | US debt downgrade |
| 2015–16 | -15% | China slowdown concerns |
| Q4 2018 | -23% | Fed tightening fears |
| 2020 | -30% | COVID shock |
| 2022 | -35% | Inflation and rate hikes |
| 2024/25 | Current correction | AI valuation reset and macro concerns |
The key observation is that most of these corrections occurred within broader long-term growth cycles.
with structural earnings deterioration or simply reprice a strong trend.
Example: Q4 2018 Correction
The Nasdaq-100 fell approximately 23% between September and December 2018.
Investor concerns included:
- Rising interest rates
- Trade-war uncertainty
- Slowing global growth
Yet by the end of 2019:
- Microsoft gained over 55%
- Apple gained over 85%
- Nasdaq recovered all losses
The correction ultimately became a buying opportunity rather than a structural breakdown.
Why This Correction Feels Different
Every correction feels unique because leadership changes over time.
Today, AI sits at the center of investor expectations.
Unlike previous cycles driven by smartphones, social media, or cloud adoption, today’s market is heavily dependent on:
- AI infrastructure spending
- Data-center expansion
- Semiconductor demand
- Enterprise AI adoption
- Cloud computing growth
This concentration creates both opportunity and risk.
accelerators, and enterprise AI. The spending wave is one of the key pillars under the current Nasdaq narrative.
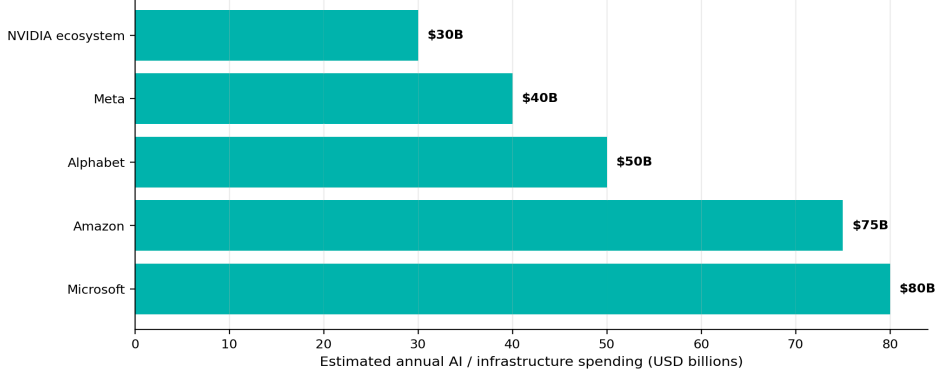
AI Spending Explosion
Estimated AI-related capital expenditures among major technology firms:
| Company | Estimated Annual AI/Infrastructure Spending |
| Microsoft | $80B+ |
| Amazon | $75B+ |
| Alphabet | $50B+ |
| Meta | $40B+ |
| NVIDIA Ecosystem Investment | Tens of billions |
Combined, major technology firms are expected to spend well over $250 billion annually on AI infrastructure.
This level of investment has few historical comparisons outside:
- The internet buildout of the late 1990s
- The smartphone revolution
- The cloud-computing expansion of the 2010s
The Magnificent Seven Effect
The Nasdaq today is more concentrated than many investors realize.
Approximate Market Capitalizations
| Company | Market Cap |
| NVIDIA | ~$5.0T |
| Microsoft | ~$3.0T |
| Apple | ~$3.0T |
| Amazon | ~$2.7T |
| Alphabet | ~$2.2T |
| Meta | ~$1.5T |
| Tesla | ~$800B |
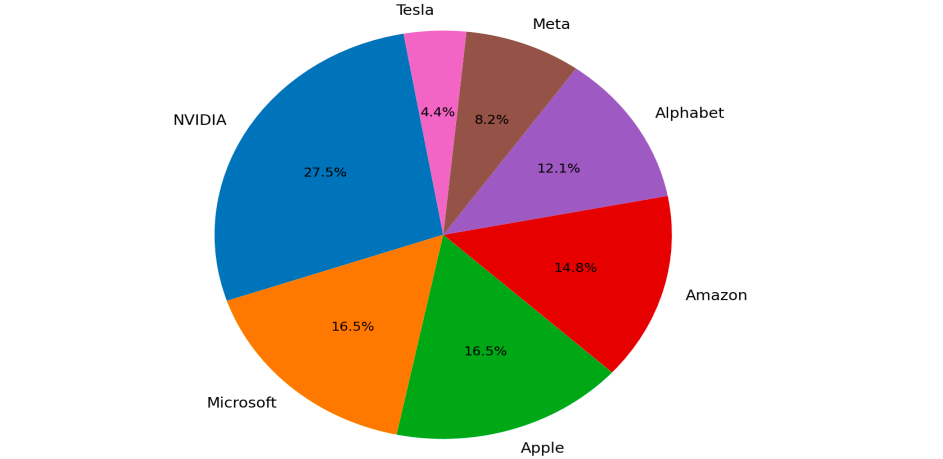
concentration helps explain why index corrections can feel severe even when the broader economy remains relatively
stable.
Combined value:
Over $18 Trillion
To put that into perspective:
- Larger than the GDP of China’s entire consumer economy
- Larger than the combined stock markets of many developed nations
- Represents a substantial percentage of Nasdaq weighting
This concentration explains why corrections can appear severe even when the broader economy remains healthy.
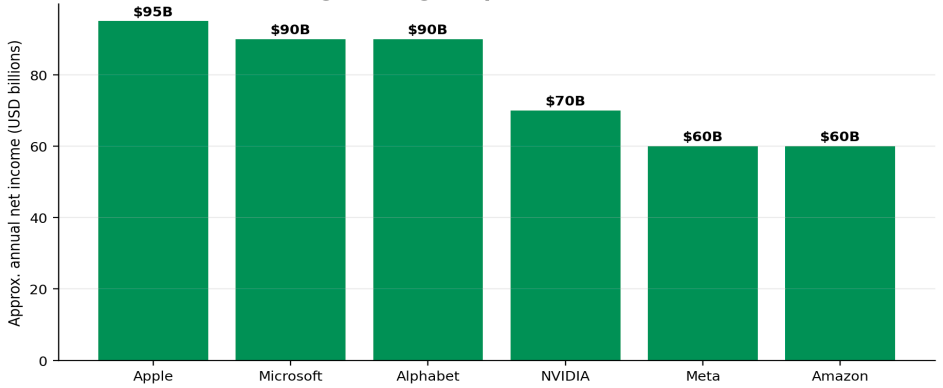
Earnings Still Matter More Than Headlines
Ultimately, stock prices follow earnings.
The largest Nasdaq companies continue producing extraordinary profits.
Recent Annual Earnings Power
difference from the dot-com era and provides real support beneath valuations.
Combined annual profits exceed:
$450 Billion
This level of profitability provides a significant cushion compared with speculative periods such as the dot-com bubble.
Dot-Com Comparison
During 1999–2000:
- Many Nasdaq leaders generated little or no profit
- Valuations depended almost entirely on future expectations
Today:
- Most leaders generate tens of billions in annual cash flow
- Balance sheets remain exceptionally strong
- Free cash flow supports buybacks and investment
This is one reason many analysts view the current correction differently from the 2000 collapse.
Interest Rates Remain the Biggest External Risk
Technology stocks are highly sensitive to interest rates because much of their valuation depends on future earnings.
Historical Relationship
When Treasury yields rise:
- Growth stock valuations often compress
- Future cash flows become less valuable
- Investors rotate toward defensive sectors
Examples:
2022
- Federal Reserve raised rates aggressively
- Nasdaq fell approximately 35%
- Technology valuations compressed sharply
2023–2024
- Inflation moderated
- Rate expectations improved
- Nasdaq rebounded strongly
This relationship remains one of the most important variables investors should monitor.
rate expectations typically support long-duration growth assets like technology.
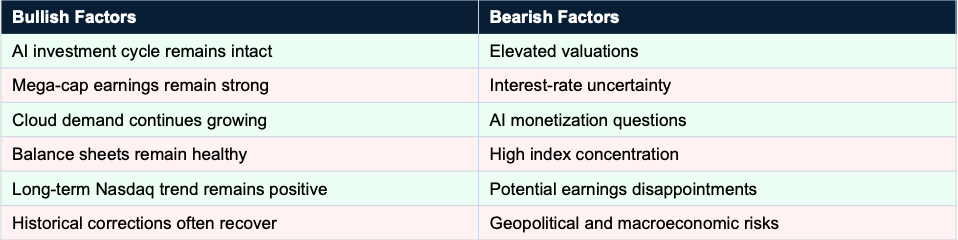
AI: Opportunity or Bubble?
The biggest debate on Wall Street today centers around AI.
Bullish vs Bearish Factors
| Bullish Factors | Bearish Factors |
| Productivity gains across industries could significantly boost economic output and corporate profitability. | AI infrastructure spending may prove excessive relative to actual demand and returns. |
| New software revenue streams could emerge from AI-powered products and services. | Monetization may take longer than investors expect, delaying returns on investment. |
| Increased cloud demand could drive sustained growth for hyperscale providers. | High capital expenditures could pressure margins and reduce profitability. |
| Semiconductor demand may remain elevated as AI adoption expands globally. | Current valuations may already reflect overly optimistic growth assumptions. |
| Enterprise automation could improve efficiency and create long-term earnings growth. | Slower adoption rates or weaker business outcomes could disappoint investors. |
| Strong balance sheets among mega-cap tech firms support continued investment. | Elevated market concentration increases downside risk if leadership weakens. |
| Potential for a multi-year innovation cycle similar to cloud computing and smartphones. | Regulatory scrutiny and geopolitical tensions could slow growth. |
Historical innovation cycles suggest both sides may be partially correct.
Historical Perspective
| Innovation Cycle | Initial Outcome | Long-Term Outcome |
| Internet | Bubble burst | Massive success |
| Smartphones | Skepticism | Massive success |
| Cloud Computing | Valuation concerns | Massive success |
| AI | Unknown | Still developing |
The lesson is that transformative technologies often experience periods of excessive optimism before ultimately creating enormous value.
Long-Term Nasdaq Performance
The Nasdaq Composite launched in 1971 with a base value of:
100
Today:
Approximately 26,800
That represents growth of more than:
26,700%
before dividends.
Few major financial assets have generated comparable long-term returns.
Growth of $10,000
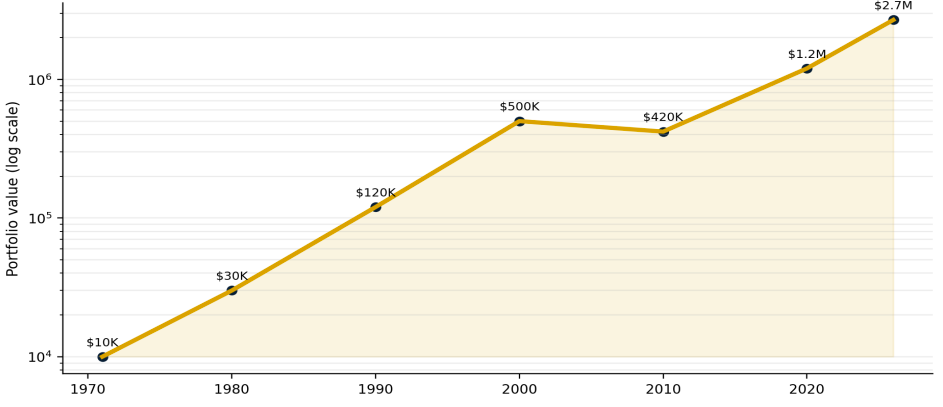
exceptional. Time in the market has historically mattered more than timing every pullback.
This illustrates why long-term investors often focus more on structural trends than short-term volatility.
Investor Dashboard
Bottom Line
The recent Nasdaq correction deserves attention, but historical context suggests investors should avoid viewing every pullback as the start of a major bear market.
Since 2009 alone, the Nasdaq has experienced multiple corrections ranging from 15% to 35%, yet continued to generate exceptional long-term returns. Today’s market differs from speculative periods of the past because many of its largest companies generate hundreds of billions of dollars in combined annual profits and possess some of the strongest balance sheets in corporate history.
The biggest question is not whether volatility will continue—it almost certainly will. The real question is whether AI-driven earnings growth can justify the enormous capital being invested across cloud infrastructure, semiconductors, software, and data centers.
For now, the evidence suggests the current decline looks more like a valuation reset within a broader innovation cycle than a clear break in the long-term Nasdaq growth story. Investors should monitor earnings, interest rates, and AI adoption closely, but history indicates that periods of fear often emerge during some of the strongest secular growth trends.

Marc has been involved in the Stock Market Media Industry for the last +5 years. After obtaining a college degree in engineering in France, he moved to Canada, where he created Money,eh?, a personal finance website.
