The stock market keeps reaching record highs, yet several indicators associated with previous periods of extreme speculation are flashing warnings. Valuations are stretched, investors are borrowing record amounts, and enthusiasm is approaching historic levels.
So why aren’t investors running for the exits?
- Stock valuations are approaching dot-com extremes.
- Leverage and investor optimism have reached dangerous levels.
- Powerful earnings continue to support the rally.
Warning #1: The S&P 500 Is Priced for Perfection
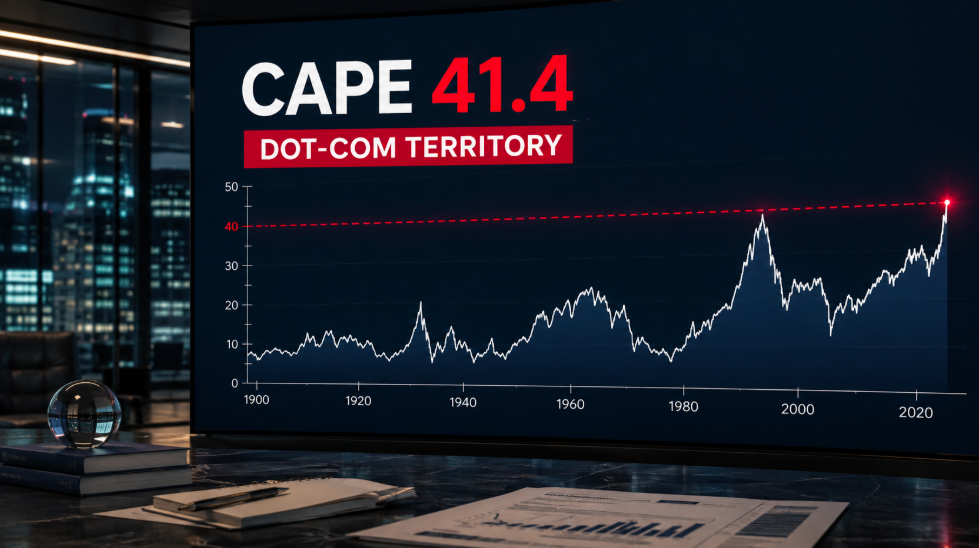
The first warning comes from the Shiller cyclically adjusted price-to-earnings ratio, better known as the CAPE ratio.
Unlike a traditional P/E ratio, CAPE compares stock prices with ten years of inflation-adjusted earnings. This helps remove some of the distortions created by temporary economic booms and recessions.
The S&P 500’s CAPE ratio recently reached approximately 41.4, compared with a long-term historical average of roughly 16 to 17. It has only exceeded 40 during two periods: the final years of the dot-com bubble and today.
In simple terms, investors are paying more than $40 for every $1 of average inflation-adjusted earnings generated by S&P 500 companies over the past decade.
That does not guarantee an imminent crash. However, it leaves little room for disappointing earnings, slowing AI demand or a renewed surge in inflation. When investors pay premium prices, even strong companies can fall sharply if their growth fails to meet expectations.
Warning #2: The Buffett Indicator Is Above 200%
Another widely followed valuation measure is also flashing red.
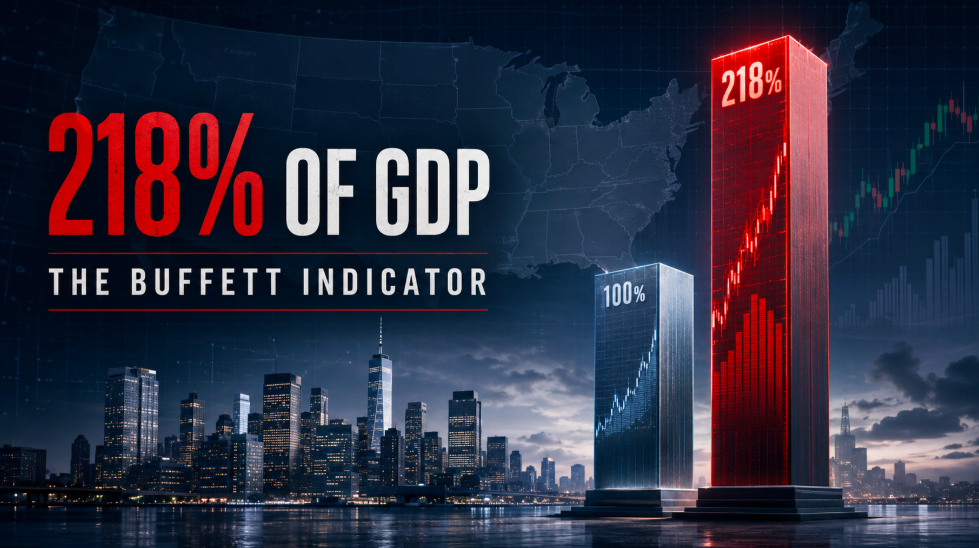
The Buffett Indicator compares the total value of the U.S. stock market with the size of the American economy. Warren Buffett once described it as one of the best ways to measure overall market valuations.
One recent calculation placed the indicator at approximately 218% of U.S. GDP, around 56% above its long-term trend. Another updated version placed it closer to 230%, depending on the market index and GDP data used.
Either way, the message is similar: the stock market is now valued at more than twice America’s annual economic output.
However, critics argue that the indicator has become less reliable because large American companies generate significant revenue internationally. Technology companies also tend to have higher profit margins than the industrial businesses that dominated the market decades ago.
The indicator may therefore exaggerate today’s overvaluation—but it is difficult to dismiss readings this extreme completely.
Warning #3: Investors Are Borrowing Record Amounts
Expensive stocks become considerably more dangerous when investors use borrowed money to buy them.
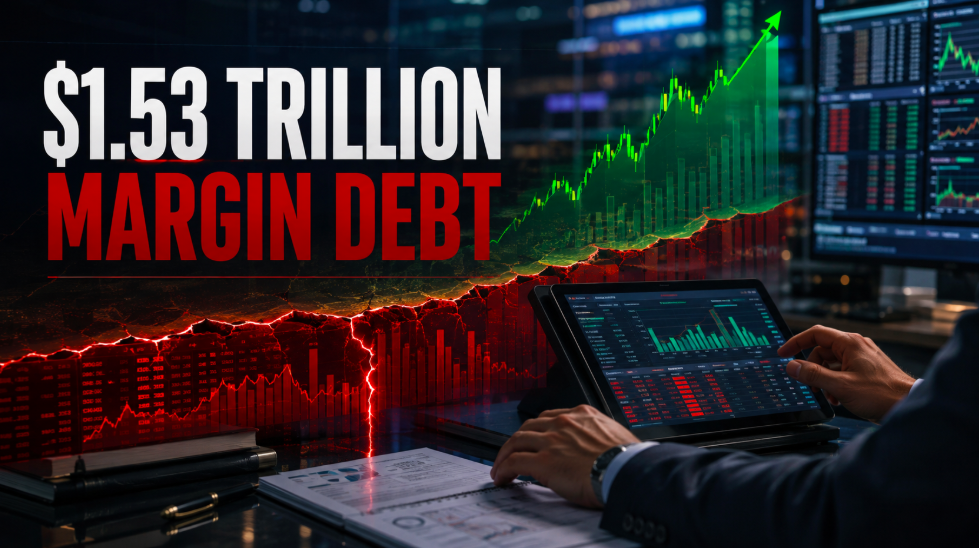
U.S. margin debt reached a record $1.53 trillion in June, rising approximately 7.9% in a single month and 51.5% from the previous year, according to data compiled from FINRA.
Margin allows investors to increase their exposure and amplify their returns. But it works in both directions.
If stock prices decline, brokers can demand additional cash or automatically sell positions. These forced liquidations can accelerate a normal correction into something far more violent.
Margin debt does not cause every crash, and it usually rises alongside the market. Nevertheless, extreme leverage means that when sentiment eventually turns, the selling could spread rapidly.
Warning #4: Investors Are Almost Fully Committed
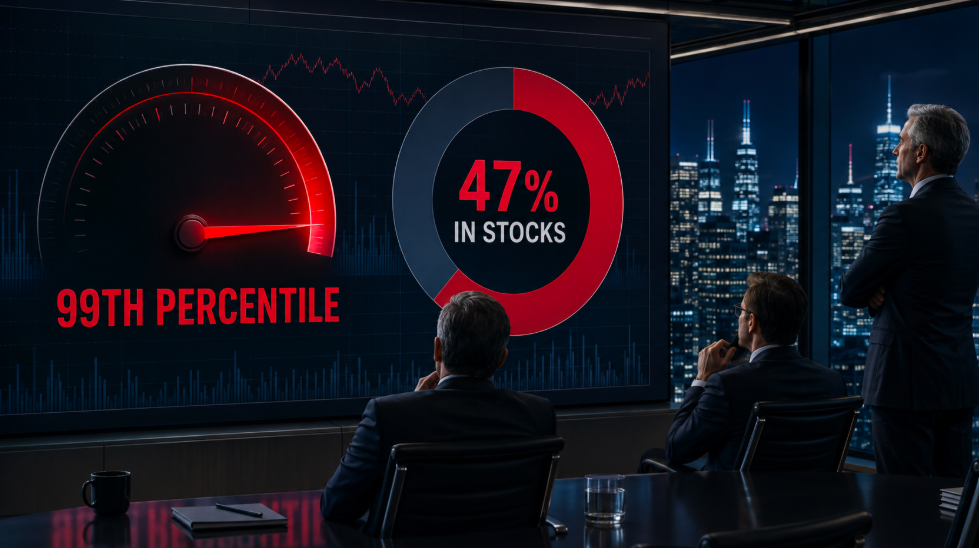
Goldman Sachs’ Risk Appetite Indicator recently entered the 99th percentile of observations going back to 1991.
That means investors have rarely demonstrated a greater willingness to accept risk.
American households are also heavily exposed. Stocks now represent more than 47% of household financial assets, nearly three times their share following the 2008 financial crisis.
This creates a potentially dangerous feedback loop. Rising stock prices make households feel wealthier, supporting consumer spending and economic growth. But a major correction could reverse that wealth effect, weakening spending and potentially dragging the wider economy down with the market.
The problem is not simply that investors are optimistic. It is that an enormous amount of money may already be positioned for continued gains.
So Why Is Wall Street Still Buying?
The bullish answer can be summarized in one word: earnings.
By early August, 88% of S&P 500 companies had reported their second-quarter results. Of those companies, 86% exceeded earnings expectations, compared with a five-year average of 78%.
The index was also reporting blended earnings growth of approximately 50.4%. Those numbers were heavily influenced by Alphabet and Amazon, but even excluding both companies, S&P 500 earnings growth remained around 32%.
That is not what a traditional bubble looks like.
During the dot-com era, many highly valued technology companies had little revenue and no realistic path to profitability. Today’s market leaders—including Microsoft, Nvidia, Alphabet, Amazon and Meta—generate enormous revenues, profits and cash flows.
Goldman Sachs expects S&P 500 earnings per share to reach approximately $340 in 2026, representing annual growth of around 24%. If those forecasts prove accurate, the market could gradually grow into some of its elevated valuation.
Wall Street is therefore not buying because investors are unaware of the risks. It is buying because corporate earnings remain powerful enough to justify continued optimism.

Warning Signs Are Not Market Timers
This is the crucial distinction.
CAPE, the Buffett Indicator and margin debt can show that the market is expensive or vulnerable. They cannot reliably predict when prices will fall.
Valuation indicators have suggested that U.S. stocks were overvalued for much of the past decade. Investors who sold solely because CAPE appeared too high could have missed substantial gains.
Markets can remain expensive for years—particularly when earnings are rising, financial conditions remain supportive and investors believe a transformative technology is creating a new economic cycle.
The warning signs matter because they show what could happen if the bullish assumptions fail.
If AI investments generate lasting productivity gains, profit margins remain elevated and corporate earnings continue growing, Wall Street’s optimism may be justified.
But if companies fail to earn sufficient returns from hundreds of billions of dollars in AI spending, today’s valuations, leverage and extreme risk appetite could transform a disappointment into a brutal reset.

The Bottom Line
Four warning signs are flashing red, but none proves that a crash is imminent.
The market is expensive, heavily leveraged and dependent on exceptionally strong earnings. At the same time, those earnings are real, and corporate America continues to produce results that have repeatedly exceeded expectations.
Investors therefore face a difficult question: is Wall Street correctly pricing the beginning of a once-in-a-generation productivity boom—or is it repeating the most dangerous phrase ever heard during a market bubble?
“This time is different.”
This article is for informational and educational purposes only and does not constitute financial, investment, or trading advice. It should not be relied upon as a recommendation to buy or sell any securities. Investing in financial markets involves risk, including the possible loss of principal. Readers should conduct their own research or consult a qualified financial advisor before making investment decisions.

Marc has been involved in the Stock Market Media Industry for the last +5 years. After obtaining a college degree in engineering in France, he moved to Canada, where he created Money,eh?, a personal finance website.