Sekur’s latest government opportunity puts US$3.4 million in potential annual recurring fees in front of investors. That equals approximately US$283,333 monthly and US$850,000 quarterly at full deployment.
Converting this request could create an earnings base large enough to support substantial share-price repricing. Our central illustration produces US$2.16 million in annual earnings before tax and an implied US$0.21 share price, rounded up.
That calculation assumes a 90% gross margin, US$900,000 in annual costs below gross profit and 25× earnings. It uses approximately 260 million basic shares and assumes eligible tax losses eliminate the modeled income-tax expense. A larger deployment under discussion could extend the opportunity to US$6 million–US$12 million annually.
- Revenue scale: US$3.4 million in quoted annual fees equals 4.7 times management’s annualized revenue benchmark for profitability.
- High-margin earnings potential: The central scenario produces US$2.16 million before tax and a rounded-up US$0.21 share price.
- Expansion potential: Separate US$6 million and US$12 million revenue cases imply rounded-up prices of US$0.31 and US$0.62.
What the Announcement Delivers in Numbers
The October 27 release identifies three components at stated annual retail prices.
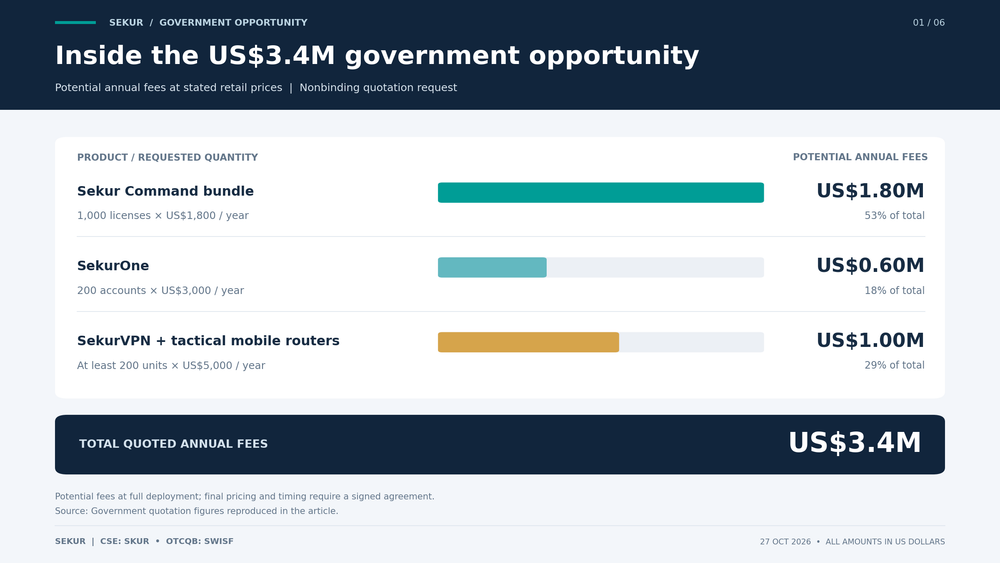
The Command bundle contributes approximately 53% of quoted fees, routers contribute 29%, and SekurOne accounts contribute 18%. The commercial opportunity therefore spans several products within one prospective customer.
Management describes discussions as advanced. The request remains nonbinding, with the country and agency undisclosed under an NDA.
For shareholders, the release supplies a measurable opportunity: defined volumes, annual prices and a potential recurring fee stream. Successful conversion would give Sekur a government deployment that could support expansion within that customer and future sales discussions.
Why US$3.4 Million Could Change the Earnings Picture
Management’s September shareholder letter estimated that 200 SekurOne subscribers could bring Sekur to profitability. Its illustration used US$300 monthly per subscriber, producing US$60,000 in gross monthly recurring revenue.
That represents US$720,000 annually, compared with US$3.4 million in the government quotation.
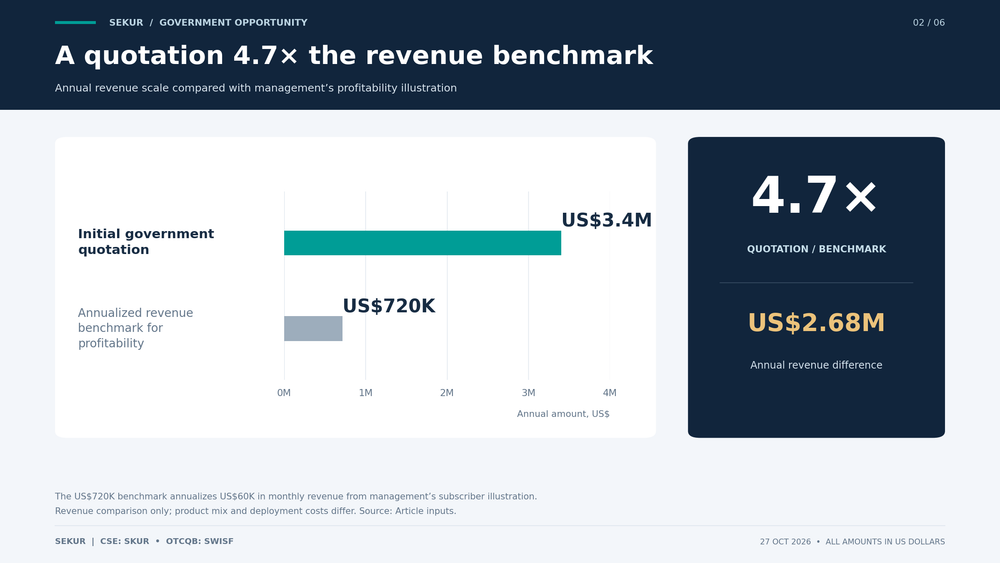
The government request uses US$3,000 annually per SekurOne account. Its 200 accounts therefore represent US$600,000 annually, with the other products adding US$2.8 million.
The full package is what makes the opportunity financially significant. It offers revenue scale beyond the standalone subscriber illustration.
Our inference is that a successful deployment could give Sekur greater scope to cover corporate costs and generate earnings. The 4.7× comparison measures revenue scale; deployment costs determine how much becomes profit.
The Gross-Margin Bridge to Earnings
Sekur’s February 11, 2026 corporate update described software gross margins of 80% per dollar sold. I model an 80%–90% gross-margin range to show the potential earnings at the quoted revenue scale.
Gross profit measures revenue after direct delivery costs. Corporate overhead, financing and other expenses still need to be deducted.
For this illustration, I assume US$900,000 of annual costs below gross profit. That allowance must cover all remaining charges before tax, without double-counting costs already included in gross margin. It is a forward modeling assumption, rather than a verified historical annual cost base.
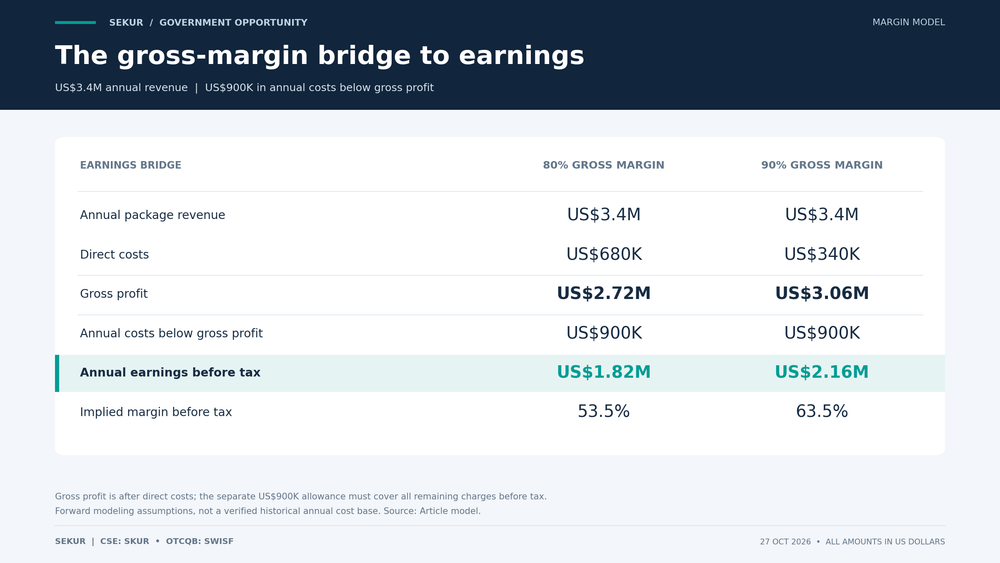
The central 90% gross-margin case converts US$3.4 million in revenue into US$2.16 million before tax. The actual blended margin will depend on software, router and server economics, final pricing and support requirements.
Tax Losses Could Help Retain Early Profits
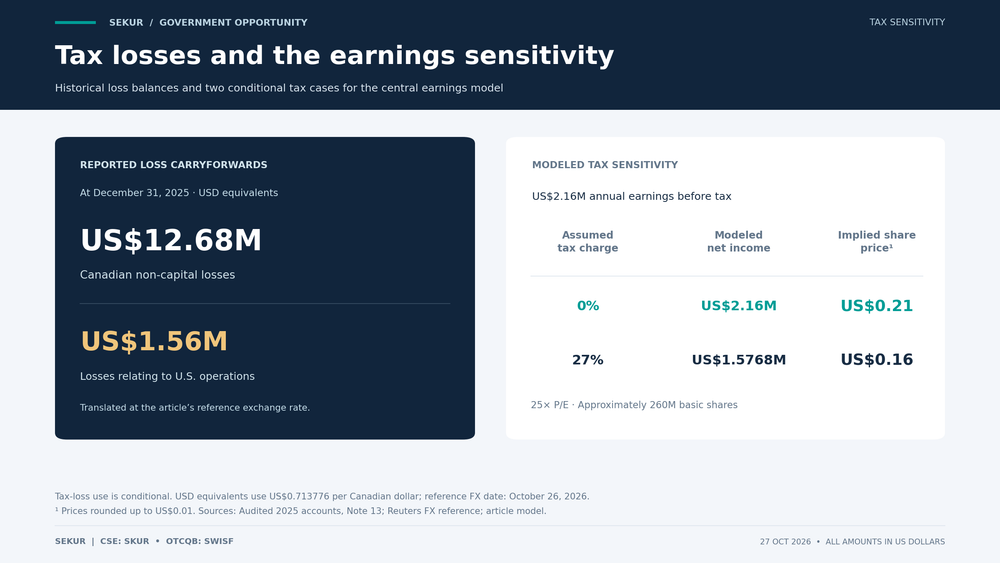
Sekur’s audited 2025 accounts reported year-end non-capital loss carryforwards equivalent to approximately US$12.68 million in Canada. Losses relating to U.S. operations were equivalent to approximately US$1.56 million. These are U.S.-dollar translations using the article’s reference exchange rate.
Those balances could offset eligible future taxable income, supporting cash retention as the business reaches profitability. Their use depends on the entity earning the income, local rules and remaining availability. A group-wide loss balance does not establish that every contract will generate tax-free earnings.
The valuation cases below assume zero income-tax expense while eligible losses offset the modeled profit. Under that assumption, earnings before tax equal modeled net income. Cash tax payments and accounting tax expense can differ; both need confirmation before treating the illustration as an earnings forecast.
This assumption has a measurable effect. Applying an illustrative 27% tax charge to the central case produces US$1.5768 million in net income. At 25× earnings, that implies a rounded-up US$0.16 per share, compared with US$0.21 under the zero-tax assumption.
A Conditional 2027 Revenue Forecast
The full package would represent US$3.4 million of annual fees once operating at the quoted scale. The amount recognized during 2027 would depend on when paid services begin.
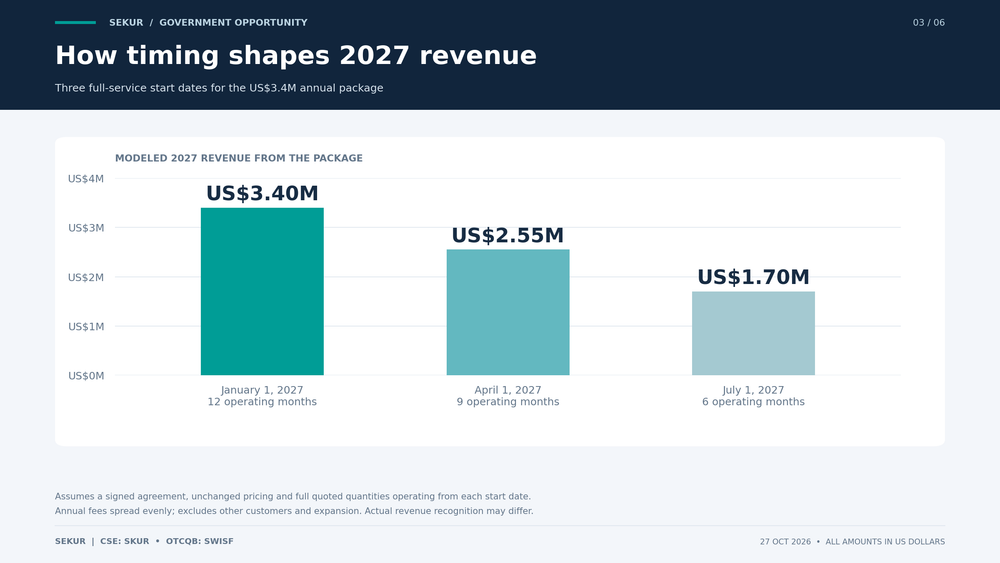
These are conditional forecasts assuming a signed agreement, unchanged pricing and the full quoted quantities operating from the stated date. They spread annual fees evenly; actual recognition will depend on contract terms and any separately allocated hardware revenue.
Existing customers, additional government contracts and the larger installation contribute no extra revenue to this forecast. The forecast isolates the opportunity announced on October 27.
What Could That Imply for the Share Price?
The valuation model uses an illustrative US$0.025 comparison price and approximately 260 million basic shares. Those inputs imply a reference equity value of approximately US$6.5 million.
US$0.025 is an illustrative comparison price. The share-count assumption is based on the June 30 filing and shown in rounded form. It represents a historical basic count; subsequent financing, warrants and options could change the denominator.
We model three profitable outcomes on US$3.4 million of annual revenue. Each deducts US$900,000 in annual costs below gross profit and assumes zero income-tax expense.
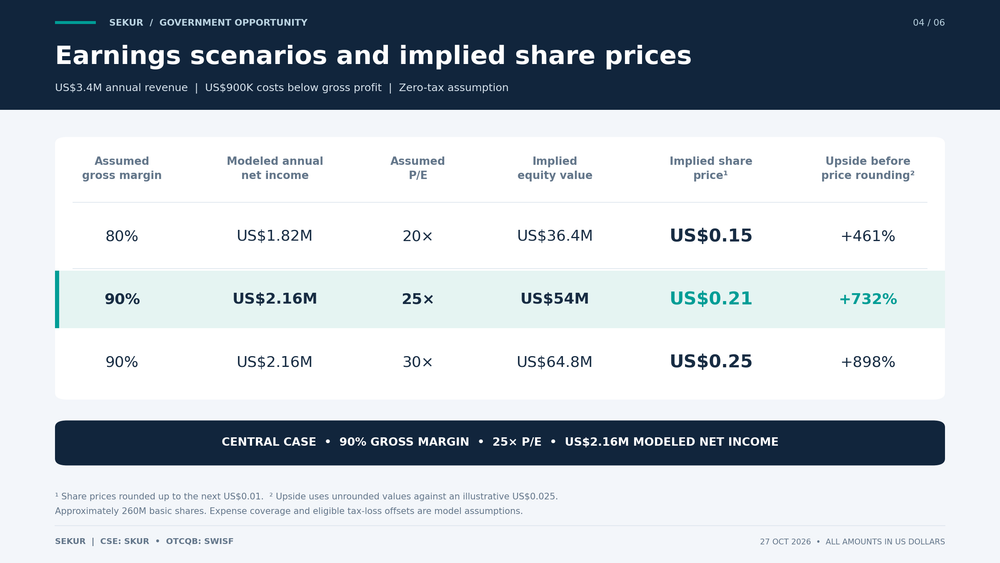
Implied share prices are rounded up to the next US$0.01 throughout this article. Upside percentages compare unrounded model values with US$0.025.
Formula: Modeled annual net income × P/E ÷ share count = implied share value.
Modeled net income equals revenue × gross margin, less the annual expense allowance and assumed income-tax expense. The central case includes US$340,000 in direct costs plus US$900,000 in other annual expenses.
The contract margins, expense allowance, tax treatment and multiples are analytical assumptions. These cases value a profitable annual operating scale after deployment; they do not predict the immediate reaction to a signature.
The bullish argument is that recurring government earnings could give investors a stronger basis for valuing Sekur. A business generating US$2.16 million under these assumptions would present a different financial proposition from its current commercialization stage.
Why Financing Proceeds Belong in the Share-Count Model
A financing changes both the share count and the capital available to the business. New proceeds could support sales and deployment, potentially expanding the earnings base.
The central model uses approximately 260 million basic shares, with calculations retaining the underlying reported count. A financing scenario would specify the issuance price, net proceeds and use of funds alongside the new share count. More shares reduce ownership per share; the capital received can also support growth or strengthen the balance sheet.
An updated fully diluted model would also require warrant and option terms. Any cash adjustment must avoid counting funds already reflected in the earnings forecast.
A Higher-Margin Subscription Illustration
A separate subscription illustration shows how stronger margins and a higher earnings multiple could amplify the valuation. This scenario assumes 50× earnings once the business becomes profitable.
The calculation starts with 1,000 licenses at US$3,000 annually, producing US$3 million before a hypothetical government discount. It then assumes approximately US$2.5 million in revenue. A 90% gross margin produces US$2.25 million in gross profit. Deducting an assumed US$450,000 in other annual costs leaves US$1.8 million before tax and under the zero-tax assumption.
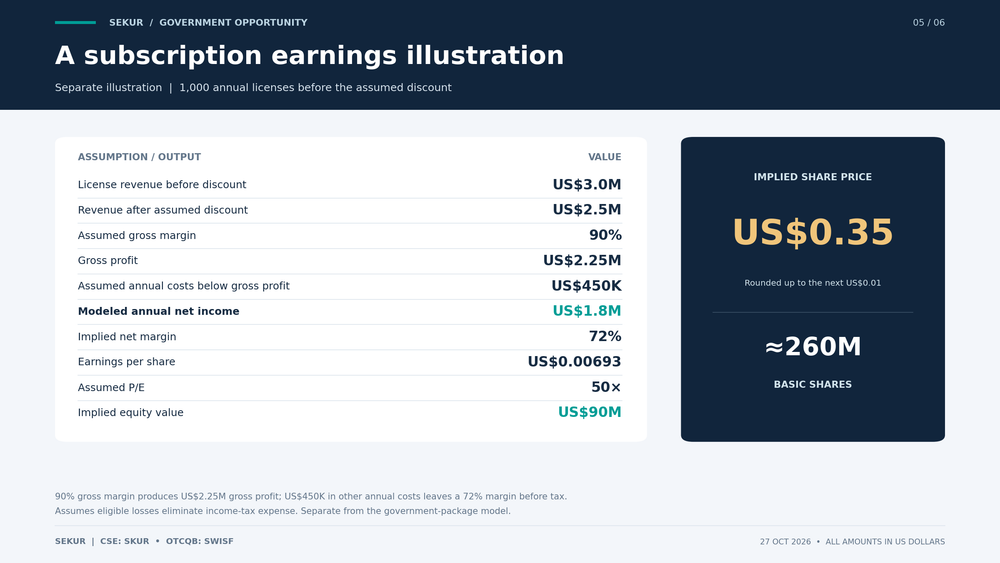
This scenario assumes the expense allowance covers all remaining charges and eligible losses eliminate income-tax expense. Its 72% net margin follows from the gross-profit and expense assumptions; it is distinct from the 90% gross margin. The 50× earnings multiple is a separate analytical assumption.
The example shows how a subscription-focused cost structure and a higher earnings multiple could amplify the valuation. It is a separate illustration with a smaller expense allowance. The central government-package model uses US$900,000 in other annual costs and 25× earnings.
The US$6 Million–US$12 Million Expansion Scenario
Sekur also disclosed discussions about an installation within the customer’s facilities for 2,500–5,000 users. Including hardware and maintenance, management indicated US$6 million–US$12 million in potential annual value.
Those amounts are excluded from the initial quotation. We model each as a standalone revenue case, without adding US$3.4 million to either figure.
For the larger installations, I use an 80% blended gross margin to reflect the server and hardware component. Costs below gross profit increase proportionately with revenue from the US$900,000 allowance on US$3.4 million.
That produces an approximately 53.5% modeled net margin under the same zero-tax assumption. The valuation retains 25× earnings and approximately 260 million basic shares. The initial-package scenario retains its separate 90% central gross-margin assumption.
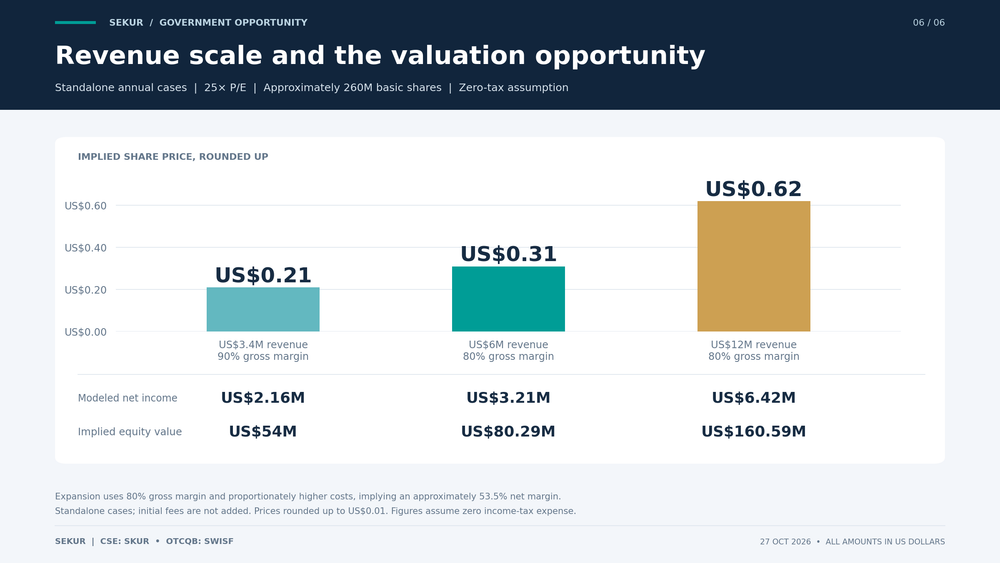
Before price rounding, the expansion cases imply approximately 1,137% and 2,374% upside against the illustrative US$0.025 reference. Those outputs depend on the assumed margins, proportional expense growth, eligible tax losses and valuation multiple. Actual server, maintenance and support costs will determine the earnings achieved.
The potential progression from US$3.4 million to a larger deployment is the most powerful part of the longer-term bullish thesis. It offers a route to expanding the business within one government relationship.
What Could Trigger a Repricing?
The first catalyst would be a signed agreement establishing committed purchases, final pricing and payment terms. Deployment and the first reported revenue would then help investors assess the earnings opportunity.
Upfront annual payments could support implementation cash needs. Subscription revenue would generally be recognized over the service period.
The starting financial position remains relevant. Translated into U.S. dollars, the unaudited first-half accounts reported approximately US$132,640 in revenue and a US$1.56 million net loss. Operating cash outflow was approximately US$878,000. June-end cash and equivalents were approximately US$1.09 million.
Management’s September letter described planned financing of up to US$1.4 million for commercialization and sales. Successful conversion must therefore deliver profitable revenue while funding the rollout.
The central bullish case implies a rounded-up US$0.21 per share after establishing the modeled earnings. Larger deployment scenarios extend the illustration to US$0.31–US$0.62. The opportunity is substantial because one customer could change Sekur’s revenue scale and provide a foundation for recurring government earnings.
Sources and Model Notes
- Sekur government quotation announcement, October 27, 2026
- Sekur shareholder letter, September 1, 2026
- Sekur corporate update, February 11, 2026: software gross-margin commentary
- Sekur audited financial statements, year ended December 31, 2025: Note 13, income taxes
- Sekur unaudited interim financial statements, six months ended June 30, 2026
- Reuters exchange-rate reference, October 26, 2026
All monetary amounts are presented in U.S. dollars. Historical financial-statement and tax-loss figures are approximate U.S.-dollar equivalents. They use the October 26, 2026 reference rate of approximately US$0.713776 per Canadian dollar, based on Reuters. These conversions aid comparison and do not restate the original financial statements. The model uses approximately 260 million basic shares based on the June 30 filing; calculations retain the underlying reported count. This is a historical denominator. Share prices are rounded up to the next US$0.01; percentage changes use unrounded model values. The central case assumes 90% gross margin, US$900,000 in annual costs below gross profit, zero income-tax expense and 25× earnings. Larger installations use 80% gross margin and proportionately higher expenses; the subscription illustration has a separate cost base and multiple. Tax-loss availability is conditional; the zero-tax assumption is not a permanent tax rate. The forecasts assume contract conversion. Valuation cases have no assigned probability or guaranteed price-adjustment date.
Disclosure: The author has a prior professional relationship with Sekur’s management.

Marc has been involved in the Stock Market Media Industry for the last +5 years. After obtaining a college degree in engineering in France, he moved to Canada, where he created Money,eh?, a personal finance website.